緣起
Introduction about CPMD
Today 's technology advances and the meteorological science is no exception, thanks to improvements in technology and the long-term accumulation of relevant knowledge. When we enjoy the convenience of meteorological science and technology for life, have we thought of how much time these technologies are developed. How did it begin?
These questions can be answered to some extent through
the historical meteorological records collected by the Central Weather Administration.
#Early
We are focusing on the period from the Japanese Era to the end of World War II (1897-1950). The historical meteorological records include hand-writing observational record books, all sorts of strip charts, and weather charts.
#Historical meteorological records
The historical meteorological records include hand-writing observational record books, all sorts of strip charts, and weather charts.
These historical meteorological records are precious historical data collected by our predecessors. We can see many aspects of the meteorological history in Taiwan and the weather in the past by peeking through these data. The long record of data is also crucial for understanding the regional climate characteristics.
However, the paper records are fragile and decomposing over time. Central Weather Administration has started a great project that digitizes all these data to preserve the completion of our records.
The project you see is part of the great project. After the historical weather charts are scanned, the information on the map needs to be digitized as well. Therefore, we need your help to label all important weather systems.
認識天氣圖
Education
Introduction of symbols on weather charts
Air mass
When a widespread body of air stays at the same region long enough, its property, such as temperature and moisture distribution, becomes approximately homogeneous. For example, the continental cold air mass forms in Siberia winter time. Air mass won't be labeled in weather charts, but its explanation is needed to understand the formation of fronts.
Front
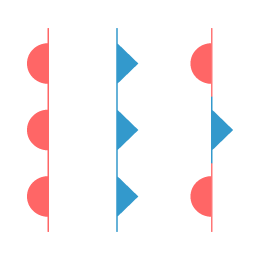
The interface or transition zone between two air masses of different properties. When the intensity of two air masses is equal, the front lingers around for several days which is called a stationary front. If the cold air mass is stronger and pushes the front toward the warm air mass, it is called a cold front. On the contrary, it is a warm front.
High and Low (Pressure systems)
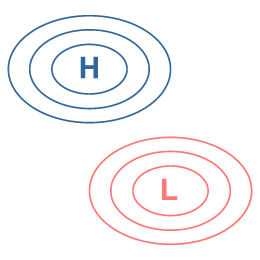
High (low) is a local maximum (minimum) in pressure or geopotential height in two dimensions (closed isobars). In meteorology, high and low are relative to each other. There is no threshold to define a system as high or low.
Typhoon
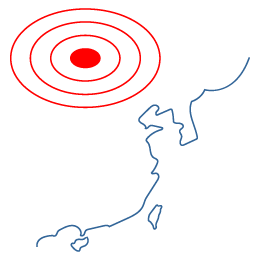
Typhoon is a severe tropical weather system. The system will be marked as TD and monitored closely once it reaches the intensity of tropical depression (wind speed stronger than 20 km/hour). And will be marked by the symbol of typhoon once it reaches the intensity of Typhoon (wind speed stronger than 62 km/hr).
Hand writing information
Sometimes, forecasters wrote important weather information and warming message on the space of weather charts. These hand-writings high-lighted the most important message and may brought you back to the past.